Introduction
The sub-regional boundaries reflect Interim Biodiversity Regionals of Australia (IBRA) sub-regions and cropping zones in the South West of Western Australia (SWWA) and a range of socio-economic differences (Table 1).
Avon Arc | Central | Eastern | Southern | GWW | |
Hydrology | Avon River | Central Lake System | Eastern Lake System | Southern Lake System | Eastern Lake System |
Total Area million (ha) | 1.38 | 2.71 | 1.73 | 2.48 | 3.42 |
% Native Veg | 9% | 6% | 13% | 17% | 98% |
Mining (Area under mining tenements) | - | - | 11% | - | 40% |
Population | 23,420 | 12,950 | 2,360 | 5,210 | (?) |
Land use (population %) | Agriculture (13%) Urban (60%) Peri-urban (27%) |
Agriculture (36%) Urban (64%) |
Agriculture (34%) Urban (66%) |
Agriculture (38%) Urban (62%) |
Mining (100%) |
Population Trend (2000 – 2010) | +10% | - 8% | - 25% | - 5% | No trend |
Population density (#/sq km) | 1.31 | 0.37 | 0.12 | 0.08 | 0.05 |
IBRA sub regions | Avon Wheatbelt (2) | Avon Wheatbelt (1) | Avon Wheatbelt (1) | Mallee (2) | Coolgardie (2) |
Cropping zones | H3 / M3 | M3 / L3 | L3 | M4 / L4 | - |
The Avon Arc is characterised by (relative to the rest of the ARB):
The Central sub-region is characterised by:
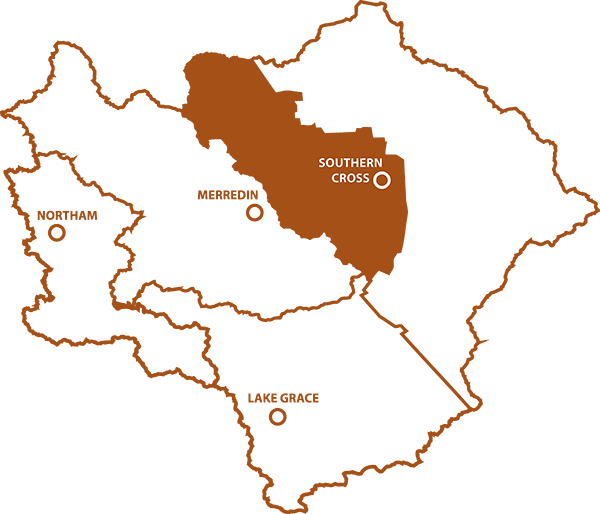
The Eastern sub-region is characterised by:
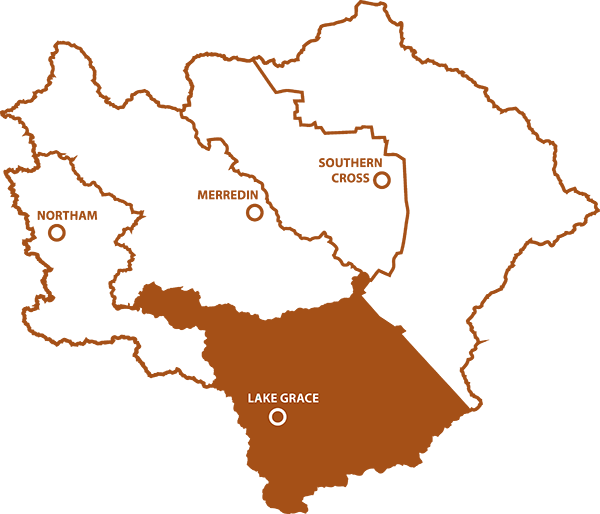
The Southern Region is characterised by:
The Great Western Woodland is characterised by: